Subnational Economic Resilience
A validation-first multivariate study of Philippine subnational economies: prove that sectoral growth structure shifted over time, then classify 117 provinces and cities into two resilience pathways.
Overview
Regional GDP averages away what matters locally — two provinces can post identical growth while one runs on diversified services and another on a single volatile sector. There was no structural way to group economies by how they actually grow and how stable that growth is.
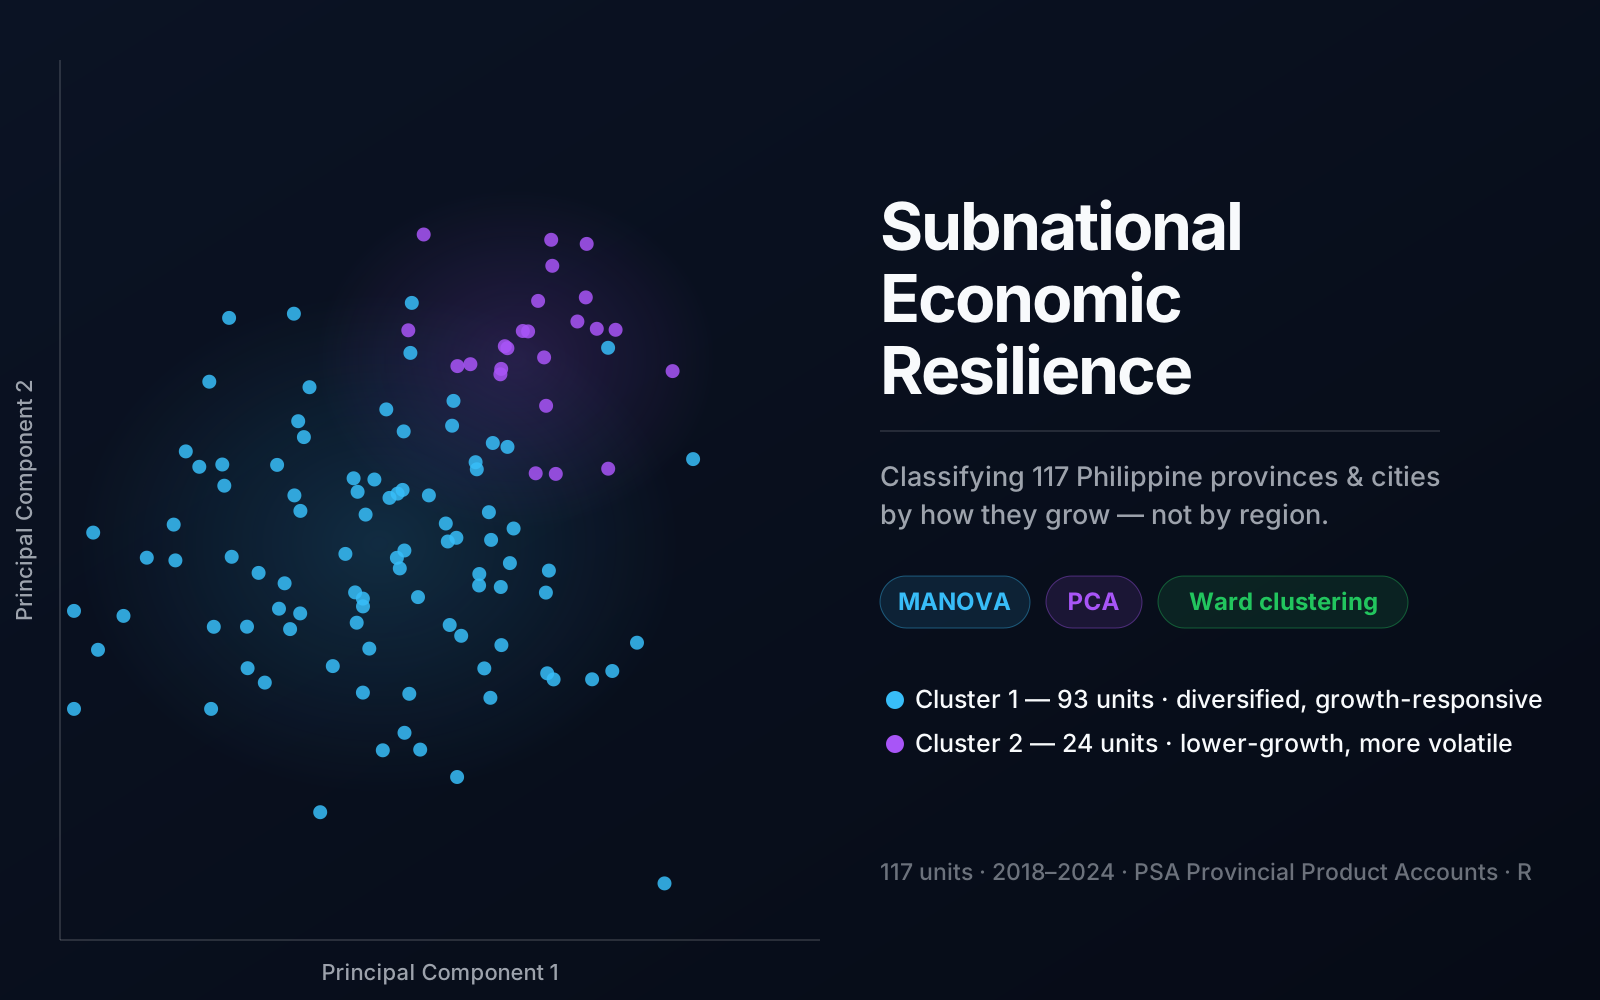
Two exploratory resilience typologies emerged: a diversified, growth-responsive group of 93 units and a lower-growth, more volatile group of 24 — cutting across the usual province-versus-city lines. The clustering separation is modest (silhouette 0.29), so the typologies are framed as a way to prioritize where to look closer, not as hard verdicts.
Method used.
- Computed year-on-year real growth (constant 2018 prices) for six consolidated sectors across six intervals — 702 unit-by-interval observations from PSA Provincial Product Accounts.
- Validated with a one-way MANOVA (Pillai’s Trace, chosen because Mardia’s test showed non-normality) that the six-sector growth structure genuinely differs across time before attempting any classification.
- Reduced 12 correlated indicators to 6 components (81% of variance) with PCA, then applied Ward’s hierarchical clustering; chose k by silhouette and stress-tested against k-means and three internal validity indices.