← Back to projects Dashboard Analytics
Sales Performance Dashboard
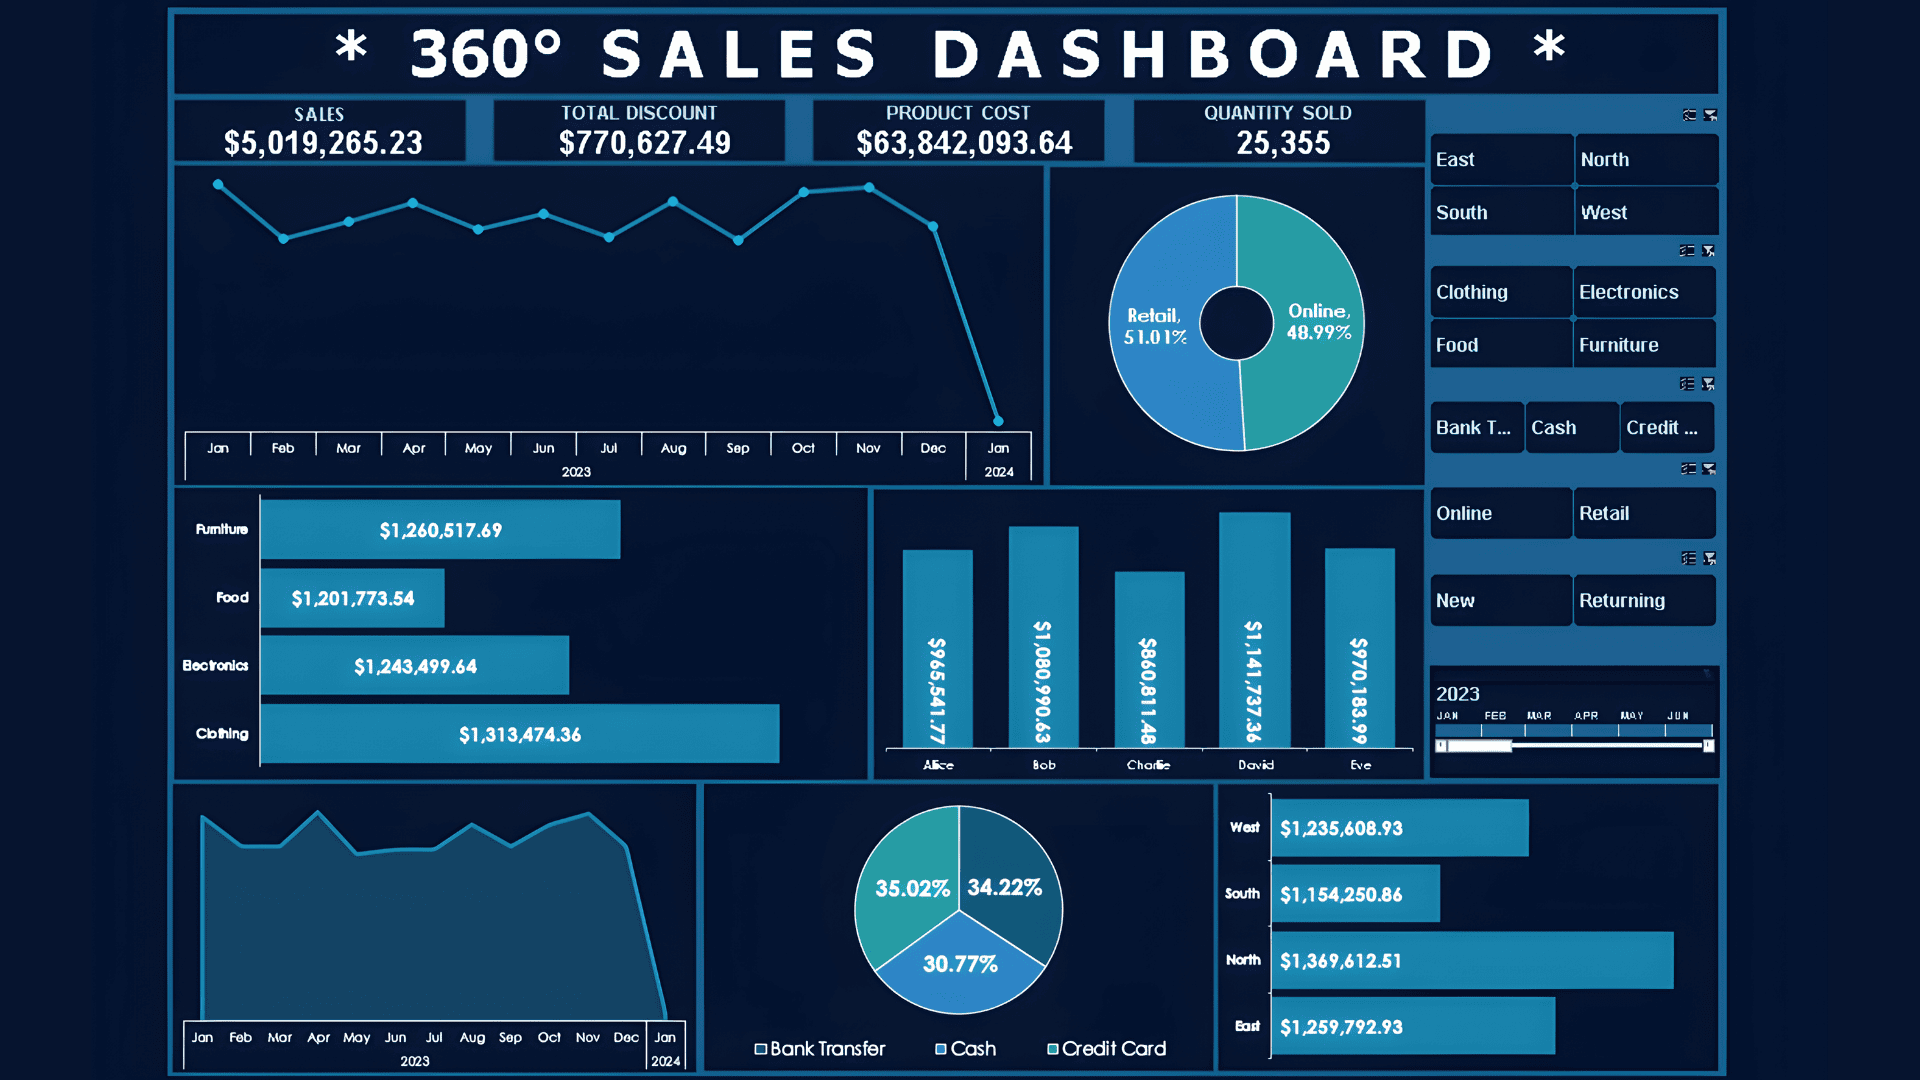
Built a sales dashboard that turns a $5M+ dataset into clearer views of revenue, discounts, category performance, and trends.
Overview
Problem
Large sales data can hide discount inefficiencies, uneven category contribution, and weak signal visibility for decision makers.
Outcome
The dashboard turns raw sales numbers into a clearer performance view for monitoring and business analysis.
Approach
Method used.
- Structured the dataset for clearer KPI analysis.
- Designed dashboard views around revenue trends, discount behavior, and category performance.
- Focused on making business patterns easier to review.
Project links